Foreign Direct Investment Up: Govt. True, But Not When Compared To GDP
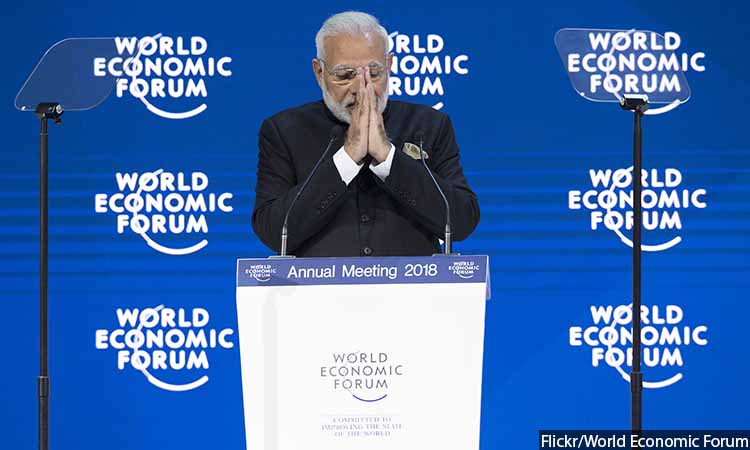 "text-align: justify;">Mumbai: “Foreign direct investment in India increased from $36 billion to $60 billion,” prime minister Narendra Modi claimed in an infographic on May 25, 2018, as the Bharatiya Janata Party (BJP)-led National Democratic Alliance (NDA) government completed four years at the Centre.
 The BJP claimed that the increase in foreign direct investment (FDI) was from 2013-14 to 2016-17.
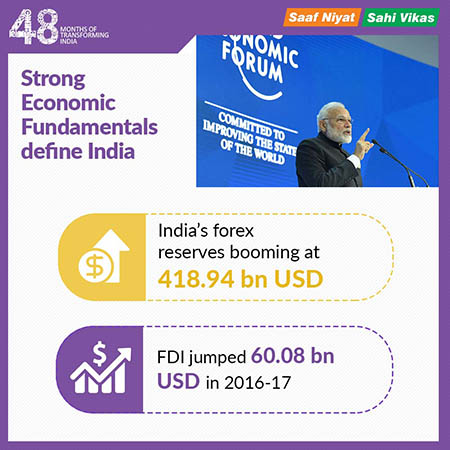 "text-align: justify;">The claim is true in absolute terms: FDI increased from $36 billion in 2013-14 to $60 billion in 2016-17, according to data from the department of industrial policy and promotion, a division of the ministry of commerce and industry. But that increase does not hold good when FDI is considered as a proportion of gross domestic product (GDP), which increased 7.35%, on average, over three years to 2017.
 We sought comments from the office of the minister for commerce by telephone on May 30, 2018, and were directed to a joint secretary, who asked us to send our queries to the press office. We emailed a detailed questionnaire to the office the same day, but have not received a response. We will update the story if and when we receive a response.
“It is good news that there has been an increase in FDI inflows,” said Madan Sabnavis, chief economist of CARE Ratings, a credit rating agency.
The improvement in ease of doing business ranks for India and the reforms have played a role in attracting FDI to the country, Sabnavis said.
FDI from April to December 2017 was $48.2 billion, a marginal increase (0.4%) from $48.03 billion during the same period of the previous financial year (2016-17).
FDI increased from $34.5 billion to $44.4 billion from 2014-15 to 2016-17, according to World Bank data.
The difference between the DIPP numbers and the World Bank data is due to the definition of FDI. The World Bank definition does not include capital raised locally by foreign companies in a host country as FDI.
| Flow Of FDI To India, 2014-2017 | |||
|---|---|---|---|
| Year | Department Of Industrial Policy & Promotion | World Bank | |
| FDI (In $ billion) | Year-On-Year Change (In %) | FDI (In $ billion) | |
| 2013-14 | 36 | (+)5% | 28.15 |
| 2014-15 | 45.1 | (+) 25% | 34.5 |
| 2015-16 | 55.5 | (+) 23% | 44 |
| 2016-17 | 60 | (+) 8% | 44.4 |
| 2017-18** | 48.2 | ||
Source: Department of Industrial Policy and Promotion(DIPP) & World Bank Note: Figures are provisional for 2014-15 to 2017-18. Data for 2017-18 are as of December 2017
China gets maximum FDI among BRICS nations
China received the highest average FDI--with $227 billion for 2014-16--4.5 times more than India, which ranked fourth with $41 billion.
FDI as a percentage of gross domestic product--an indicator used to measure the strength of an economy--is down to 2% in 2016 from 2.1% in 2015, according to World Bank data. It was the highest at 3.6% in 2008.
‘It is true that the FDI share of GDP has improved since the Modi government came to power but it is nowhere near the rate achieved under the UPA (United Progressive Alliance) at its peak,” economist Rupa Subramanya wrote in The Hindustan Times on May 26, 2018.
“Indeed, FDI’s share of GDP actually dipped in 2016-2017, the last fiscal year for which we have full year data.”
During the Congress-led UPA-I (April 2004 to May 2009), FDI as a proportion of GDP increased from 0.9% to 2.7%, reaching a peak of 3.6% (the highest ever since 1975). During UPA-II (May 2009 to May 2014), the ratio declined from 2.7% to 1.7%.
FDI higher under NDA than UPA
FDI inflow during the the first three years (2014-16) of the NDA government was $160.78 billion, up more than three times compared to UPA-I ($ 37.83 billion) and 35% higher than UPA-II ($119.14 billion).
“One needs to remember that the $60 billion number comes from equity (fresh foreign investments) and reinvestments from local companies, and the percentage of equity is lower this time,” said CARE’s Sabnavis. “FDI and other foreign investments are important since India depends on them for funding the current account deficit.”
“The FDI inflows for 2017-18 (currently at $48.2 billion) will hover around $50-$60 billion, as there is some improvement in more stable economies,” said Sabnavis. “With increasing investment in infrastructure, FDI inflows may go there.”
With inputs from Manpreet Singh, an MSc student at the Symbiosis School of Economics, Pune, and an intern at IndiaSpend and FactChecker.
This is the fourth part in our series checking the National Democratic Alliance government’s claims on completion of four years in office. You can read the other parts here: Smart Cities: Rs 2 lakh Cr Budget; 0.09% Of Central Funds Spent Ujjwala Yojana Performs As Per Claim, But Challenges Evident 20 New AIIMs Coming Up: BJP. Fact: 11 Get 3% Funding Foreign Direct Investment Up: Govt. True, But Not When Compared To GDP Least Train Mishaps In 2017-18, But 3 Times More People Dead In NDA’s 4 Years 85% Rural Work Wages Paid On Time: BJP. Claim Reflects Pay Orders Not Wages 8 Of BJP’s 15 Claims On Rural Sector Check Out, 5 Do Not (Salve is an analyst at IndiaSpend and FactChecker.) "text-align: justify;">We welcome feedback. Please write to respond@indiaspend.org. We reserve the right to edit responses for language and grammar. __________________________________________________________________ "text-align: justify;">“Liked this story? Indiaspend.org is a non-profit, and we depend on readers like you to drive our public-interest journalism efforts. Donate Rs 500; Rs 1,000, Rs 2,000.”