Telecom Ministry: Wrong Claims, Bad Maths
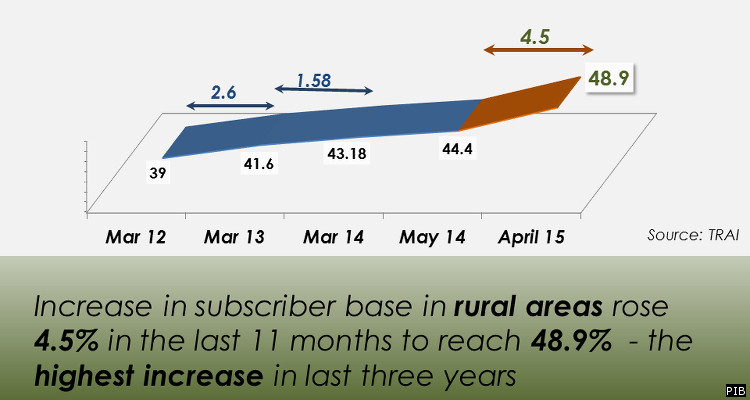
At the end of a year since Prime Minister Narendra Modi took office, the telecommunications ministry put out a series of tweets, putting forward its achievements. Here are three problems we found with the claims. We emailed our findings to the ministry last week, requesting comment. There was no response. 1. Tele-density: 4.2% growth fastest ever. Compounded annual growth rate (CAGR) of national tele-density for 4 year period between 2008 and 2012 is 31.6%. Claim: National tele-density increased fastest (4.3%) over 11 months to reach 79.9%. Subscriber base in rural areas rose 4.5% over the past 11 months to reach 48.9%.
National teledensity increased the fastest in last 11 months: @rsprasad
#SaalEkShuruaatAnek pic.twitter.com/l9x35AVtZJ
— PIB India (@PIB_India) June 2, 2015| As on | Rural tele-density (%) | Urban tele-density (%) | Overall tele-density (%) | Increase (year-on-year) overall tele-density (%) | Increase (year-on-year) rural tele-density (%) | Increase (year-on-year) urban tele-density (%) |
|---|---|---|---|---|---|---|
| Mar 31, 2008 | 9.5 | 66.4 | 26.2 | - | - | - |
| Mar 31, 2009 | 15.1 | 88.8 | 37.0 | 10.8 | 5.7 | 22.5 |
| Mar 31, 2010 | 24.3 | 119.5 | 52.7 | 15.8 | 9.2 | 30.6 |
| Mar 31, 2011 | 33.8 | 156.9 | 70.9 | 18.2 | 9.5 | 37.5 |
| Mar 31, 2012 | 39.2 | 169.6 | 78.7 | 7.8 | 5.4 | 12.6 |
| Mar 31, 2013 | 41.0 | 147.0 | 73.3 | -5.3 | 1.8 | -22.6 |
| Mar 31, 2014 | 44.0 | 145.8 | 75.2 | 1.9 | 2.9 | -1.2 |
| Mar 31, 2015 | 48.4 | 148.6 | 79.4 | 4.2 | 4.4 | 2.8 |
There has been a revolution in broadband: @rsprasad
#SaalEkShuruaatAnek pic.twitter.com/4DkfEplQEo
— PIB India (@PIB_India) June 2, 2015| As on | Wireless Broadband Subscribers (Phone+Dongle) (in millions) | Wireline Broadband Subscribers (in millions) | Total Broadband Subscribers (in millions) |
|---|---|---|---|
| Mar 31, 2014 | 46 | 14.9 | 60.9 |
| Mar 31, 2015 | 83.7 | 15.5 | 99.2 |
Source: TRAI
The wireline broadband subscription of state-owned BSNL declined during 2014-15 whereas MTNL added only 10,000 broadband connections during the same time period.| Wireline Broadband Subscribers (in millions) | ||
|---|---|---|
| As on | BSNL | MTNL |
| Mar 31, 2014 | 10 | 1.13 |
| Mar 31, 2015 | 9.96 | 1.14 |
Source: TRAI
Wireless broadband subscription increased during 2014-15 primarily because of more than 90% growth in the subscription base of private players like Bharti, Idea and Vodafone put together. State-owned BSNL registered around 30% growth in wireless broadband.| Wireless Broadband Subscribers (Phone+Dongle) (in millions) | |||||
|---|---|---|---|---|---|
| As on | BSNL | Bharti | Idea | Reliance | Vodafone |
| Mar 31, 2014 | 6.8 | 11 | 7.2 | 7.1 | 7 |
| Mar 31, 2015 | 8.9 | 20.6 | 14.5 | 7.8 | 19.4 |
Source: TRAI
Note: Our calculations have been done for the financial year, while the government has done them for 10 months. 3. Increase in subscribers of both BSNL & MTNL: No, subscribers declined Claim: BSNL and MTNL added 4.7 million and 0.2 million subscribers respectively during 2014-15.If you can do so well in calamities, can do much better in normal times:@rsprasad to BSNL & MTNL
#SaalEkShuruaatAnek pic.twitter.com/nyW3WPvJUn
— PIB India (@PIB_India) June 2, 2015| Landline Subscriber Base | ||||
|---|---|---|---|---|
| As on | No. of BSNL subscribers | No. of MTNL subscribers | Decrease in BSNL subscribers | Increase in MTNL subscribers |
| Mar 31, 2014 | 18,488,147 | 3,528,752 | - | - |
| Mar 31, 2015 | 16,412,440 | 3,551,671 | -2,075,707 | 22,919 |
Source: TRAI
| Wireless Subscribers | ||||
|---|---|---|---|---|
| As on | No. of BSNL subscribers | No. of MTNL subscribers | Decrease in BSNL subscribers | Increase in MTNL subscribers |
| Mar 31, 2014 | 94,649,445 | 3,372,336 | - | - |
| Mar 31, 2015 | 77,223,655 | 3,511,744 | -17,425,790 | 139,408 |
Source: TRAI
Tomorrow: Sanitation Ministry: Old Wine, New Bottles You can read the earlier pieces in the series below: 1) Overblown, Misleading Claims By 14 Modi Ministries 2) Agriculture Ministry: Old Schemes Renamed, Other Misleading Claims 3) Health Ministry: New Claims, No New Programmes 4) Power Ministry: Marginal Improvements 5) Railway Ministry: 8 Achievements That Really Aren’t 6) Road Transport Ministry: Continues UPA’s Work, Contradicts Own Data (Manoj K is a graduate of the Indian Institute of Technology, Delhi, and the founder of the Centre for Governance and Development. He has a special interest in transparency and accountability in governance and has spearheaded several projects on these subjects. He can be contacted at manoj@cgdindia.org.)References:
Fact Check 1
- Lok Sabha: http://164.100.47.132/Annexture_New/lsq16/3/au1693.htm
- TRAI: http://www.trai.gov.in/Content/PressReleases.aspx
Fact Check 2
Fact Check 3

Advertisement
Next Story